What Really Matters for Table LLMs?
A Meta-Evaluation of Model and Data Effects
Naihao Deng 1* , Sheng Zhang 2 , Henghui Zhu 3 , Shuaichen Chang 2 , Jiani Zhang 5 , Alexander Hanbo Li 4 , Chung-Wei Hang 2 , Hideo Kobayashi 2 , Yiqun Hu 2 , Patrick Ng 2
1University of Michigan · 2AWS AI Labs · 3Figma · 4OKX · 5Google
* Work done during Naihao's internship at AWS
📝 Abstract
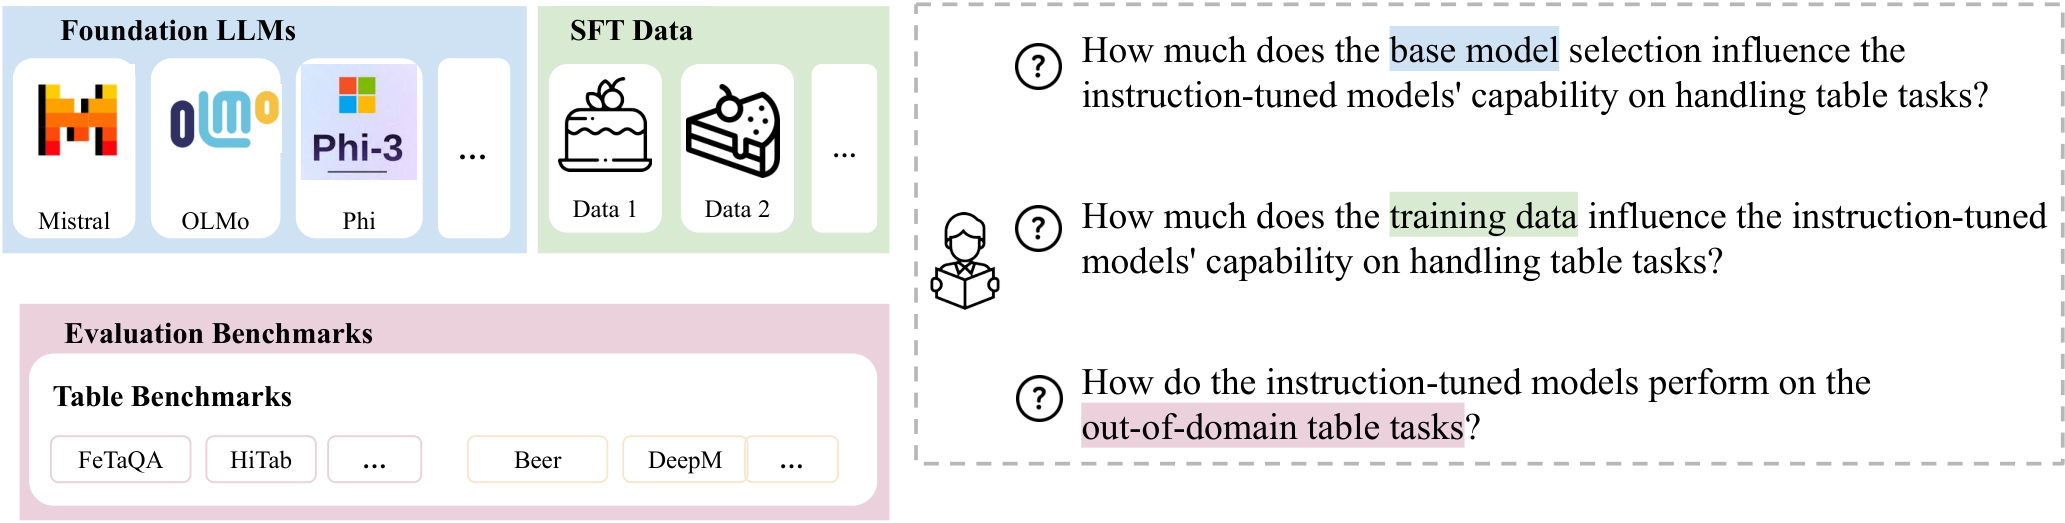
Table understanding has evolved over decades of NLP research. In this work, we revisit this trajectory and highlight emerging challenges in the LLM era — particularly the paradox of choice: the difficulty of attributing performance gains amid diverse base models and training sets in the context of table instruction tuning.
We replicate four table LLMs by instruction-tuning three foundation models on four existing datasets, yielding 12 models. We then evaluate these models across 16 table benchmarks. Our study is the first to quantitatively disentangle the effects of training data and base model selection, revealing that base model choice plays a more dominant role than the training data itself. Generalization and reasoning remain challenging, inviting future effort on table modeling.
⚡ TL;DR
- ▸Replicated 4 existing table LLMs (TableLlama, TableLLM, TableBenchLLM, TableGPT) on 3 7B base models (Mistral-v0.3, OLMo, Phi-3) → 12 models.
- ▸Evaluated all 12 across 16 table benchmarks + 5 general-capability benchmarks.
- ▸Used Shapley R² decomposition to quantify the relative contributions of base model vs. training data.
- ▸Finding: base model choice dominates; the training-corpus effect is smaller than commonly assumed.
📊 Results browser
Per-{base, training corpus, benchmark} metric. Toggle the chips to focus on a subset of base models, training corpora, or benchmarks. Cells are colour-scaled within each column (darker = higher).
| Model | wikitq | fetaqa | tabfact | tabmwp | totto | infotabs | tatqa | hitab | tablebench | TLLM·wtq | TLLM·fetaqa | TLLM·tatqa | TLLM·ottqa | Beer | DeepM | Efthymiou | Spreadsheets_CF | Spreadsheets_DI | Spreadsheets_ED_Real | Spreadsheets_MVI_ColumnNoSep | instruction_following |
|---|---|---|---|---|---|---|---|---|---|---|---|---|---|---|---|---|---|---|---|---|---|
| mistral-v0.3-tablellama | 19.0 | 65.1 | 86.9 | 28.1 | 53.2 | 27.7 | 13.3 | 33.5 | 16.9 | — | — | — | — | 41.1 | 73.1 | 55.2 | 8.3 | 48.8 | 28.3 | 69.0 | 0.1 |
| mistral-v0.3-tablellm | 5.6 | 40.5 | 3.5 | 3.7 | 22.4 | 2.9 | 11.1 | 1.3 | 3.5 | 8.7 | 40.2 | 14.4 | 8.5 | 29.6 | 90.7 | 96.6 | 42.8 | 60.4 | 21.6 | 83.3 | 0.0 |
| mistral-v0.3-tablebench | 6.9 | 31.3 | 4.0 | 3.7 | 18.8 | 5.1 | 8.3 | 1.1 | 19.2 | — | — | — | — | 87.8 | 85.7 | 97.5 | 42.6 | 64.0 | 23.9 | 84.2 | 0.1 |
| mistral-v0.3-tablegpt | 15.8 | 42.3 | 3.2 | 13.3 | 31.1 | 4.5 | 16.1 | 6.7 | 11.0 | — | — | — | — | 25.5 | 93.6 | 97.2 | 45.5 | 69.1 | 44.9 | 83.8 | 0.1 |
| mistral-v0.3-tablegpt-small | — | — | — | — | — | — | — | — | — | — | — | — | — | 25.5 | 89.1 | 97.0 | 44.1 | 69.1 | 40.7 | 84.8 | — |
| olmo-tablellama | 0.6 | 63.8 | 83.8 | 12.6 | 50.3 | 0.0 | 10.7 | 3.1 | 12.5 | — | — | — | — | 3.7 | 62.2 | 65.5 | 59.7 | 63.0 | 8.8 | 85.4 | 0.1 |
| olmo-tablellm | 7.6 | 40.5 | 2.5 | 4.1 | 32.1 | 1.5 | 11.0 | 1.1 | 5.9 | 8.6 | 39.8 | 14.3 | 9.6 | 25.0 | 86.7 | 84.4 | 49.6 | 62.6 | 24.3 | 54.0 | 0.1 |
| olmo-tablebench | 5.1 | 31.0 | 2.4 | 5.3 | 27.1 | 2.2 | 10.8 | 1.4 | 14.2 | — | — | — | — | 12.3 | 75.1 | 87.8 | 60.4 | 66.0 | 15.8 | 80.5 | 0.1 |
| olmo-tablegpt | 8.5 | 41.8 | 3.1 | 10.9 | 36.6 | 2.1 | 13.7 | 3.4 | 10.9 | — | — | — | — | 25.5 | 97.7 | 83.4 | 73.0 | 68.9 | 44.7 | 81.9 | 0.1 |
| phi-3-tablellama | 40.4 | 64.1 | 86.2 | 50.7 | 55.6 | 54.2 | 29.2 | 65.2 | 22.6 | — | — | — | — | 99.5 | 92.9 | 63.2 | 67.2 | 22.7 | 34.5 | 88.0 | 0.1 |
| phi-3-tablellm | 12.3 | 52.8 | 5.6 | 6.6 | 26.1 | 3.4 | 18.1 | 2.3 | 18.4 | 9.8 | 43.1 | 16.1 | 9.7 | 59.1 | 92.5 | 97.5 | 80.6 | 70.5 | 35.1 | 88.3 | 0.1 |
| phi-3-tablebench | 11.2 | 51.2 | 4.7 | 9.0 | 21.7 | 11.2 | 16.5 | 2.1 | 18.4 | — | — | — | — | 15.8 | 67.9 | 93.5 | 69.1 | 45.2 | 13.0 | 64.4 | 0.1 |
| phi-3-tablegpt | 13.8 | 57.4 | 6.1 | 11.3 | 43.6 | 2.2 | 19.9 | 2.8 | 19.5 | — | — | — | — | 24.5 | 99.9 | 97.3 | 90.6 | 92.3 | 70.5 | 89.4 | 0.1 |
| phi-3-mini-tablellama | 28.5 | 61.5 | 81.6 | 51.1 | 52.9 | 16.4 | 28.3 | 46.4 | 18.9 | — | — | — | — | 90.0 | 57.8 | 96.7 | 43.2 | 56.7 | 23.1 | 81.5 | 0.1 |
| phi-3-mini-tablellm | 10.8 | 52.7 | 3.4 | 6.9 | 29.9 | 3.3 | 18.8 | 1.8 | 13.6 | 9.5 | 42.3 | 15.9 | 9.4 | 17.3 | 57.5 | 96.8 | 43.8 | 57.3 | 15.9 | 80.8 | 0.1 |
| phi-3-mini-tablebench | 8.3 | 51.0 | 2.2 | 4.3 | 34.0 | 8.5 | 15.6 | 1.5 | 18.1 | — | — | — | — | 9.0 | 57.9 | 97.0 | 43.4 | 57.0 | 5.8 | 79.7 | 0.1 |
| phi-3-mini-tablegpt | 11.4 | 54.3 | 14.6 | 16.2 | 47.1 | 48.4 | 16.1 | 3.2 | 16.5 | — | — | — | — | 26.1 | 85.5 | 97.2 | 86.3 | 91.1 | 63.5 | 89.1 | 0.1 |
310 cells loaded. Metric per benchmark is BLEU-4 for FeTaQA / ToTTo / TableLLM-FeTaQA, ROUGE-L for the rest. See the paper for details.
🎯 Result: base model dominates
Shapley R² decomposition over the 3×4 grid: across the 16 table benchmarks, choice of base model contributes substantially more variance than the choice of training corpus.

📚 Citation
@inproceedings{deng-etal-2026-really,
    title = "What Really Matters for Table {LLM}s? A Meta-Evaluation of Model and Data Effects",
    author = "Deng, Naihao  and Zhang, Sheng  and Zhu, Henghui  and Chang, Shuaichen  and Zhang, Jiani  and Li, Alexander Hanbo  and Hang, Chung-Wei  and Kobayashi, Hideo  and Hu, Yiqun  and Ng, Patrick",
    booktitle = "Findings of the Association for Computational Linguistics: EACL 2026",
    year = "2026",
    publisher = "Association for Computational Linguistics",
    url = "https://aclanthology.org/2026.findings-eacl.195/",
    doi = "10.18653/v1/2026.findings-eacl.195"
}